

Fed Rate Cut (September 2024): A Market-Changing Story
This is the story of a decision that shook the market, alerted traders, and gave the U.S. Dollar Index (DXY) a new direction. The impact of the Fed Rate Cut unfolded in four phases, and each phase added a unique twist to the narrative.
Phase 1: The Calm Before the Storm (July 2024)
- The summer of July 2024 was quiet in the markets, but this calmness was a warning of an upcoming storm.
- Whispers began: “Will the Fed cut rates in September?”
- Economic experts started analyzing data and making predictions.
- Investors were paying close attention to every movement in the market.
This was the time when smart traders quietly took their positions. They knew the initial buzz was low, but it was only the beginning of a much larger story.
Phase 2: The Noise Gets Louder (August-September 2024)
- As August arrived, the buzz grew louder.
- Rumors like “The Fed might cut rates” turned into confident claims: “The Fed will cut rates.”
- Big players had already made their moves, and smaller investors started joining the action.
Phase 3: The Decision Day (19 September 2024)
- When the Fed officially announced the rate cut, it wasn’t just news – it was an explosion.
- DXY dropped sharply.
- Traders who had positioned themselves early capitalized on this moment and made significant profits.
What This Teaches Traders
- Act Early: Traders who entered during the whispers in July stayed ahead.
- Profit at the Peak: Those who exited during the loudest noise in September maximized their gains.
Phase 4: The Decline Phase (Post-Announcement): ‘An End or a New Beginning?’
After September 19, the market started to settle down.
- The story of the Fed Rate Cut was over.
- DXY hit a low point, and the market slowly became directionless.
But experienced traders knew one important truth:
- The market never stays quiet for long.
- This decline could also be the start of a new story.
Key Observations
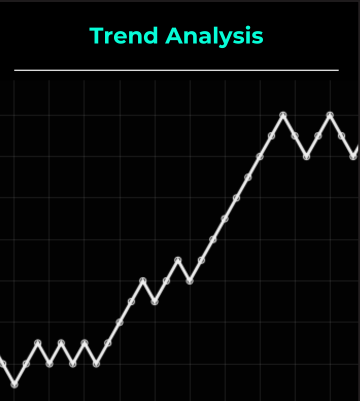
- High (Before the Announcement): DXY faced resistance at key levels before the Fed’s decision.
- Low (After the Announcement): DXY reached its lowest point post-announcement, reflecting bearish sentiment.
Time Frame
2 July 2024 to 19 September 2024.
Lessons for Traders
- Enter Early: Take positions when the noise is low.
- Exit at Peak Noise: Take profits when the buzz is at its highest.
- Wait for the Next Trend: When one story ends, a new one is always around the corner.

Trump Trade (September 2024): A Story of Market Optimism and Change
This is the story of the “Trump Trade”, where the market experienced a fresh wave of excitement fueled by a new leader’s potential return.
- The market wasn’t reacting to the person but to the policies and their impact.
- This trend drove the U.S. Dollar Index (DXY) to new heights.
Phase 1: The Nomination Withdrawal – A Leader Steps Back (July 2024)
In July 2024, President Joe Biden withdrew his nomination for the upcoming elections.
- This unexpected move sparked speculation in political and economic circles.
- “Will Trump return? And if he does, what policies will he bring?”
- Investors started taking mild bullish positions in anticipation of pro-business policies.
But this was just the beginning of a much bigger story.
Phase 2: The Trump 2.0 Speculation – Rising Expectations (August-September 2024)
During August and September 2024:
- The market was still bearish due to the Fed Rate Cut narrative.
- However, rumors and anticipation of Trump 2.0 began to shift sentiment.
The potential for Trump’s return brought optimism:
- “If Trump returns, tax cuts, infrastructure spending, and trade reforms will follow.”
- The market began pricing in these expectations, and DXY started climbing steadily upward.
Phase 3: The Peak of Trump Trade (September 2024)
At the end of September:
- After the Fed Rate Cut on September 19, the market remained calm for a few days.
- But by 29 September 2024, everything changed.
- The Trump Trade narrative gained full momentum.
DXY hit a high of 104.5, reflecting strong market confidence.
This phase proved one thing:
Policies, hopes, and expectations can be stronger than actual decisions.
Phase 4: The Decline – An End to the Chapter (5 November 2024)
By November 5, 2024:
- With the elections approaching, the market fully priced in the Trump Trade.
- DXY began losing momentum as the trend slowed down.
Key Observations
- High (Peak): DXY reached a level of 104.5 during the peak of the Trump Trade.
- Low (Early Phase): DXY experienced slight dips during the early phase of the trend.
Time Frame
29 September 2024 to 5 November 2024.
Lessons for Traders
- Spot Potential Early: Understand the market’s possibilities and act quickly.
- Capitalize on Expectations: Trends driven by speculation and hope often provide the best opportunities.
- Exit at the Peak: When the story reaches its climax, it’s the perfect time to secure profits.

Trump Tariff Fear (November 2024): A New Wave of Market Shock
This is the thrilling story of the “Trump Tariff Fear”, a market trend that shook the global economy to its core.
- Traders thought the Fed Rate Cut would keep the DXY bearish for years, but within 10 days of the Trump Trade, everything changed.
- DXY transformed into a bullet train, reaching 104.5 by the end of September.
When the Trump Trade faded after the elections, the market braced for calm. But Trump’s huge victory sparked a new bullish trend:
- The Trump Tariff Fear was born, disrupting markets and setting DXY on a new upward trajectory.
Phase 1: The Beginning of a New Trend (7 November 2024)
Following Trump’s election victory:
- Speculation about aggressive tariff policies dominated the market.
- Traders started repositioning themselves as the narrative took shape.
Phase 2: The Impact of Trump Tariff Fear
In just 15 days, the Trump Tariff Fear sent DXY soaring:
- DXY jumped from 104 to 108, gaining 400 points.
- Traders who didn’t act fast were caught off guard, suffering massive losses.
The impact on global currencies was severe:
- The Euro and other major currencies fell to record lows, resembling a crypto-style crash.
Phase 3: The Global Ripple Effect
This trend didn’t just affect DXY – it sent ripples through the entire global economy:
- Tariff fears heightened inflation concerns and disrupted trade relations.
- The trend was expected to last until mid-February 2025, when Trump clarified his tariff policies.
Key Observations
- High (108): DXY reached a significant peak, fueled by tariff fears.
- Low (104): The starting point of the trend, shortly after the Trump Trade ended.
Lessons for Traders
- Act Fast: Recognize new trends early to capitalize on sharp market moves.
- Watch for Overlap: Understand when one trend ends, and another begins.
- Stay Updated: The market thrives on evolving narratives – anticipate what’s next.
Future Predictions: The Next Trend
History shows that no trend lasts forever. FOXTRAA is already analyzing potential bearish forces to help retail traders prepare for the next big move.
The next trend could emerge from Trump’s Treasury Secretary Scott Bessent, who is known for his fiscal discipline and advocacy for balanced government spending.
- Following his nomination, U.S. Treasury bond yields dropped, signaling a potential bearish trend for DXY.
- FOXTRAA aims to reveal the Forex Forces driving these changes and guide traders toward informed decisions.

